 |
Radical Pie Equation Editor |
In addition to its equation editing capabilities, Radical Pie provides a set of drawing tools that allow you to attach a variety of lines and shapes to live anchor points within any mathematical expression. These tools can be used to add things like highlighting, boxes, and arrows to an equation for illustrative purposes. Annotations can be attached to drawing objects, and those annotations can themselves contain separate equations to which more drawing objects can be attached, ad infinitum.
When either the Line Tool or Shape Tool is selected, a set of anchor points is displayed in the equation editor. The exact locations of the anchor points are determined by the various structures in the equation, and they move as necessary to maintain their relative positions to these components as an equation is edited. The total number of anchor points belonging to an equation can be quite large, so it’s often not practical to display all of them at once. Instead, the set of anchor points that’s actually displayed at any particular time depends on the location of the insertion caret or the current selection. In the example below, the insertion caret is inside the topmost group in the equation, so blue anchor points are shown for all of the structures belonging to that topmost group, but not for the structures that are part of any subgroups.
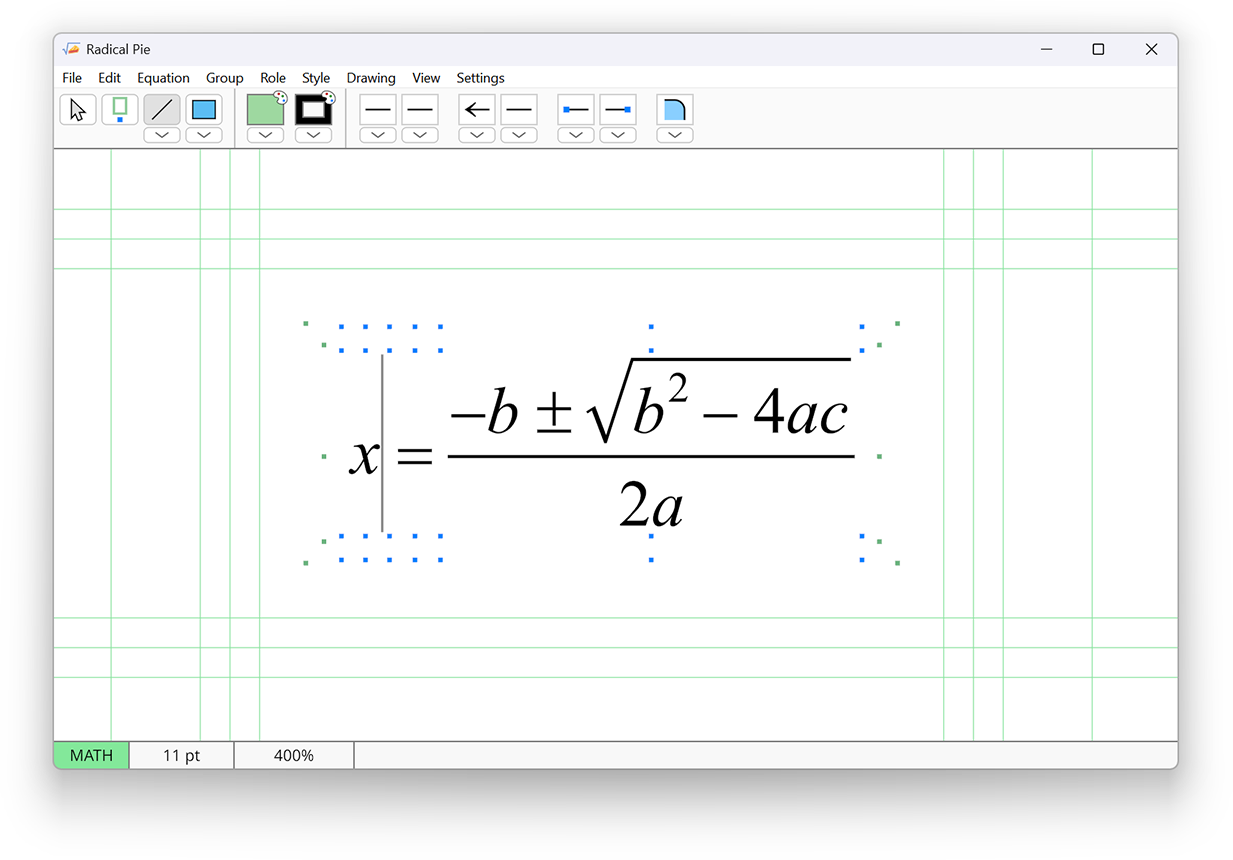
In this example, the topmost group contains three structures, the variable x, the equals sign, and the fraction. Anchor points are displayed above and below each of these structures at the right end and in the center. The anchors at the left end of one structure are equivalent to those at the right end of the preceding structure. There is a special hidden structure at the beginning of each line that provides the leftmost anchors in the group.
For top-level groups, there are two blue anchors above and below a structure at each horizontal position. This provides a couple different options for where a drawing object can be attached. The vertical distance from a structure to these anchor points can be specified in the Drawing Design dialog available in the Settings menu.
Top-level groups also display a set of green anchors that belong to the group itself. These are displayed at the vertical top, bottom and axis height for each line of text in the group. Four more green anchors are shown farther away from each top-level group at the corner positions of the group’s border. These are inteded to be used for boxing an equation.
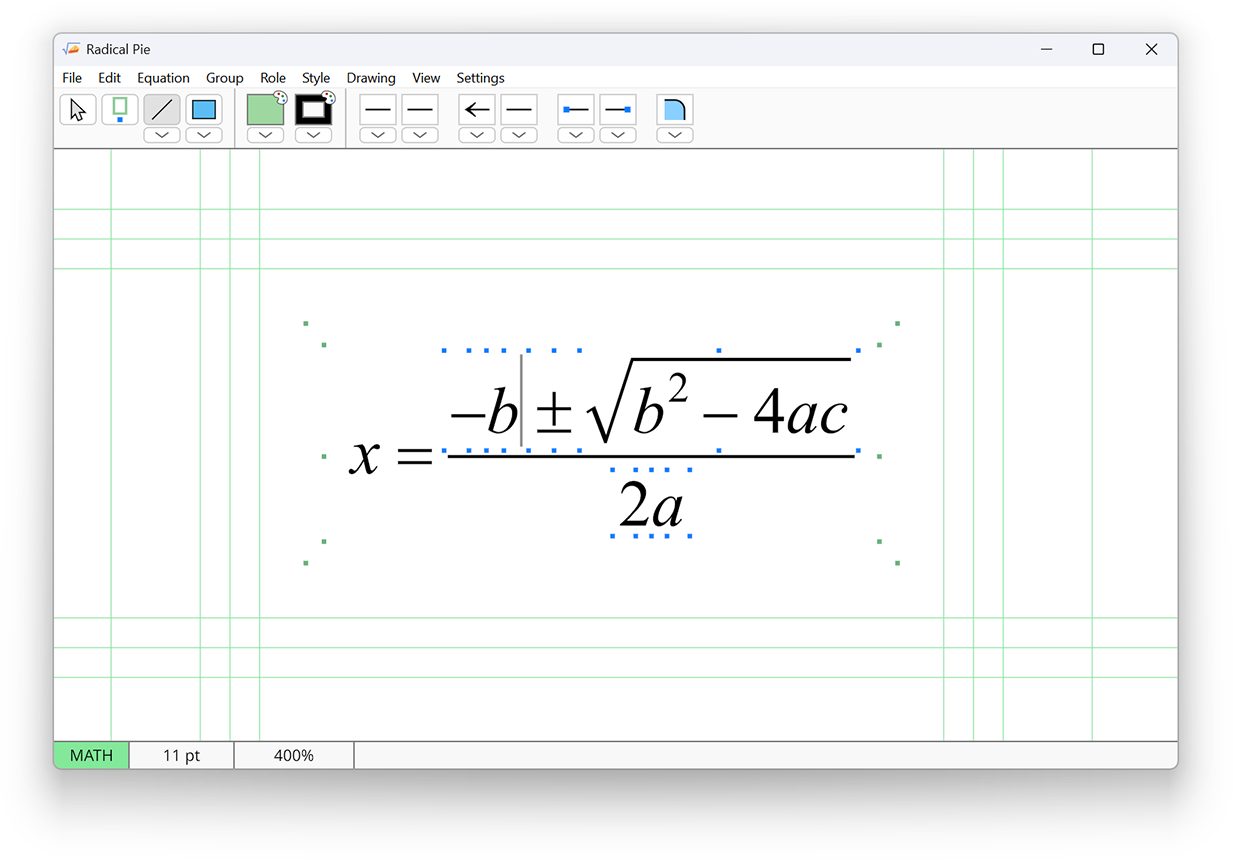
When the insertion caret is moved into a subgroup, the set of blue anchors changes to display the anchors for structures belonging to that subgroup and any sibling groups it might have. In the example shown below, the insertion caret has been moved into the numerator for the fraction, and this causes the blue anchors to be shown for structures belonging to both the numerator and the denominator. Since these are not top-level groups, only one anchor is displayed above and below the expression at each horizontal position.
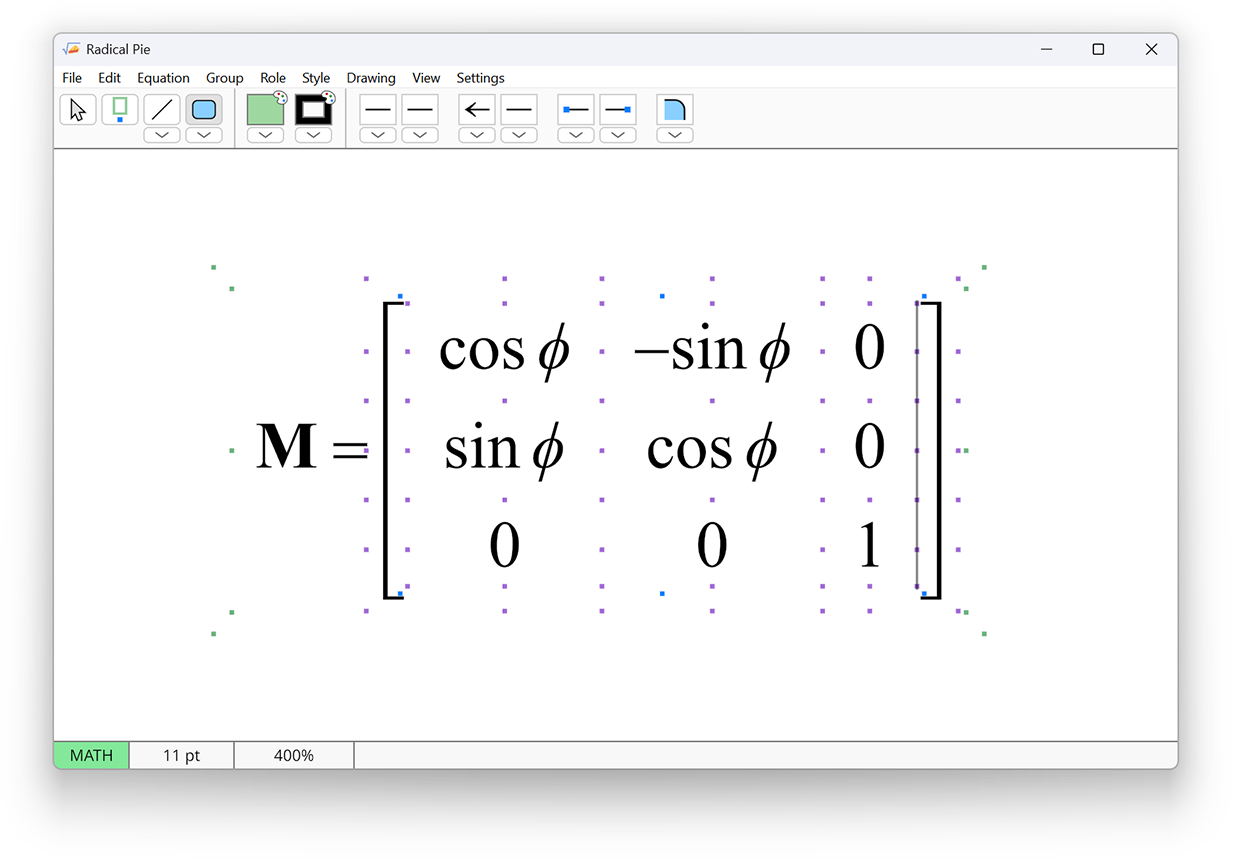
Matrices have an additional set of anchors that are colored purple by default. As shown in the screenshot below, there are anchor points before and after the entries in each row at the axis height, and there are anchor points above and below the entries in each column at the horizontal centers. These anchor points are good for drawing things like strikeouts that should pass straight through some of the matrix entries. There are also anchor points situated at the corners of each matrix cell, and these are good for drawing things like highlights or boxes around a set of entries.
Around the border of a matrix, there is an extra layer of anchor points located outside the grid of matrix cells. By default, these are placed far enough away to skip over any surrounding brackets, as shown in the screenshot below. These anchor points are good for things like attaching arrows that refer to specific rows or columns.
The green horizontal and vertical lines shown in the first two screenshots above are called rails, and they can be thought of as anchor lines instead of anchor points. When a drawing object is created, it must start on an anchor point, but its other end can be attached to a rail where it will slide along the rail in either the horizontal or vertical direction as necessary to maintain its original position relative to the starting point. The drawing tools automatically snap to the exact horizontal or vertical position of the starting anchor when the finish position is dragged to a rail.
The Line Tool is used for drawing objects that directly connect to anchors in an equation. These can be objects like straight lines, lines that take a zigzag path, or braces that stretch between to anchor points. Line objects only have a stroke color, and they do not use the fill color.
The specific type of line object to be drawn can be selected from the pull-down menu beneath the line tool, which appears as follows.
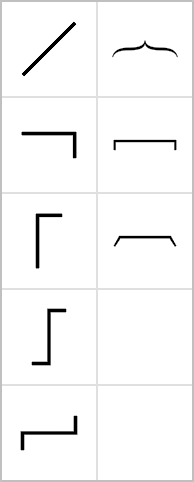
In the left column, the first tool draws straight lines between two anchors. The next two tools draw lines that start at one anchor and first extend either horizontally or vertically to match the position of the second anchor before turning a corner and connecting to second anchor in the perpendicular direction. The next two tools draw lines that follow a zigzag path between two anchors that is dominantly horizontal or vertical.
In the right column, the first two tools draw elliptical arcs that start at one anchor and first extend either horizontally or vertically to match the position of the second anchor and connect to second anchor in the perpendicular direction.
The remaining three tools in the right column draw braces, square brackets, and tortoise shell brackets that extend directly from one anchor to another. These are called joists. The direction matters here because the brace or bracket always appears on the left side of the line from the perspective of someone starting at the first anchor and traveling toward the second anchor. To flip over a brace or bracket so it appears mirrored on the opposite side of a line, draw it backwards, exchanging which anchor is the beginning and which is the end.
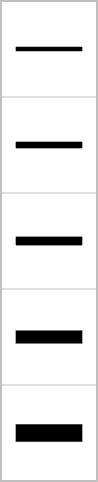
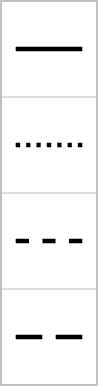
Lines can be drawn using several preset thicknesses and dashing patterns. These are selected from the first two pull-down menus to right of the drawing colors, shown when a drawing tool is active. These menus appear as follows. The actual line thickness and dash sizes can be specified in the Drawing Design dialog available in the Settings menu.
|
|
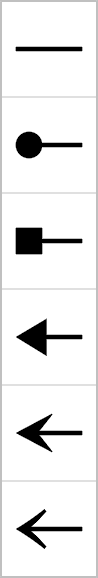
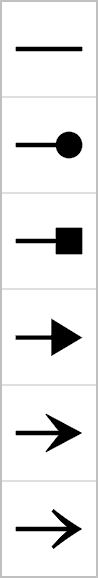
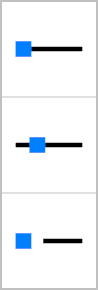
Most types of lines, those that are not stretched brackets or braces, can have one of several symbols attached to their endpoints. These can be selected from the next two pull-down menus, which have the following appearance. The first menu, in which symbols appear on the left, controls what symbol is attached to the beginning of a line, and the second menu, in which symbols appear on the right, controls what symbol is attached to the end of a line. The actual sizes and shapes of these symbols can be specified in the Drawing Design dialog available in the Settings menu.
|
|
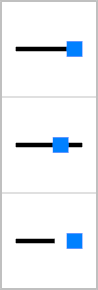
Finally, all types of lines, including stretched brackets and braces, can have their endpoints overshoot or undershoot the anchors to which they’re attached. Whether this happens can be selected from the next two pull-down menus, which have the following appearance. The first menu, in which anchors appear on the left, controls what happens at the beginning of a line, and the second menu, in which anchors appear on the right, controls what happens at the end of a line. The actual overshoot and undershoot distances can be specified in the Drawing Design dialog available in the Settings menu.
|
|
To change the thickness, dashing, endpoint symbols, or anchor offsets for existing line objects, first select the line object(s), then select the new attribute from one of the pull-down menus if necessary, and finally click on the button containing the attribute just above the pull-down menu. Clicking on the button always applies the current attribute setting to the selected objects.
The Shape Tool is used for drawing rectangles, rounded rectangles, and ellipses. Shapes can have a fill color, a stroke color, or both. As with lines, a shape is drawn between two different anchors in an equation that correspond to opposite corners of the shape. Unlike lines, the start and finish anchors for a shape must have different horizontal and vertical positions because there would otherwise be no area inside the shape.
The specific type of shape object to be drawn can be selected from the pull-down menu beneath the shape tool, which appears as follows.
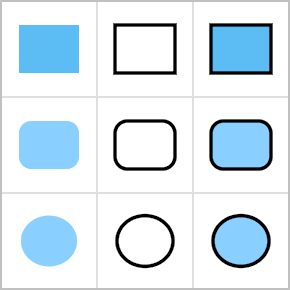
The first column contains shapes that are filled but not stroked, the middle column contains shapes that are stroked but not filled, and the last column contains shapes that are both filled and stroked.
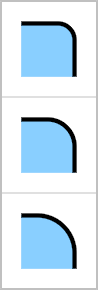
When a stroked shape is drawn, the stroke thickess and dashing pattern are set using the same buttons and menus that apply to line objects. For rounded rectangles, there is an additional attribute that controls the radius of the rounded corners, and it is specified with the last pull-down menu in the toolbar, which appears as follows. The actual radii used for rounded rectangles can be specified in the Drawing Design dialog available in the Settings menu.
To change the corner radius for existing rounded rectangles, first select the shape object(s), then select the new radius from the pull-down menu, if necessary, and finally click on the button containing the radius just above the pull-down menu. Clicking on the button always applies the current radius setting to the selected objects.
When the mouse cursor hovers over the boundary of a drawing object, an outline is displayed. Left clicking on that outline selects the drawing object unless the click could also be interpreted as a click inside an equation. In that case, the click in the equation takes priority, but a right click will still select the drawing object. Right clicks are never interpreted as clicks inside an equation.
Multiple drawing objects can be selected simultaneous by holding in the Shift key while left or right clicking. When at least one drawing object is already selected, the Select All and Select None commands in the Edit menu apply to the entire set of drawing objects instead of an equation.
When exactly one drawing object is selected, reconnect handles are displayed at the start and finish anchor positions. The reconnect handles are shown as white squares with a black border. Clicking and dragging a reconnect handle let’s you change the anchor to which the corresponding endpoint of the drawing object is attached. Note that only the finish endpoint can be attached to a rail, so it’s not possible to attach a drawing object to rails at both endpoints.
There are three layers in every equation, a background layer containing drawing objects rendered behind the main equation and any annotations, the equation layer where all mathematical expressions are rendered, and a foreground layer containing drawing objects rendered on top of the main equation and any annotations. When a new drawing object is created, whether it goes into the background layer or foreground layer is controlled by the Draw in Foreground Layer setting in the Drawing menu. When this item is not checked, new drawing objects are placed in the background layer, behind all equations, which is what’s usually desired. If this item is checked, then new drawing objects are placed in the foreground layer, possibly obscuring part of an equation. The foreground layer is good for objects like strikeout lines that should appear on top of an equation.
Drawing objects can be moved to the foreground layer or background layer by selecting them and choosing either Move to Foreground Layer or Move to Background Layer from the Drawing menu. Additional commands in the Drawing menu allow objects to be reordered within their current layer. The Bring Forward command moves the selected objects upward in front of the next higher object, if any. The Send Backward command moves the selected objects downward behind the next lower object, if any. The Bring to Front command moves the selected objects to the top of the drawing stack, and the Send to Back command moves the selected objects to the bottom of the drawing stack. These four commands keep the objects in their layers and do nothing to an object that cannot be moved further forward or backward within its current layer.